More SDs coming from Bowser

New announcements from Bowser today with good news for ACR fans, including a second run of new road numbers on their popular SD40-2 from last year, and a new model of the GMD specific versions of the SD40, including Algoma Central in the list of paint schemes.

SD40-2 (second run – new road numbers)

Road numbers 185, 186, 188 (first run had 184, 187)

Product Listing

Pre-order deadline: April 13, 2018  Expected delivery: January 2019

SD40 (new model)

Road numbers 180, 181, 182

Product Listing

Pre-order deadline: April 27, 2018  Expected delivery: February 2019

Wawa Station Build

One of the signature scenes that I plan to include on my eventual ACR layout is the Algoma Ore Properties sinter plant and ACR yard at Wawa, Ontario. Built in 1939 and expanded and upgraded many times over the next five decades, the sinter plant at Wawa upgraded the iron ore mined at nearby mines in the so called Michipicoten Iron Range in which the community of Wawa is located. The processed ore was then shipped south via the ACR to supply the Algoma Steel blast furnaces at Sault Ste. Marie.

Along with the heavy industrial facility of the AOP plant, two other key structures to model at Wawa would of course be the Algoma Central station and freight house. I knew that modelling the station had just become easier a few years ago when I arranged access to view certain archival materials at the public library in Sault Ste. Marie during my 2014 visit. One of the items listed in the inventory was “Plans for Jamestown Station Building”. (During the 1950s there was an attempt to renamed the station and community “Jamestown” in honour of Sir James Dunn, the head of the Algoma Steel Co. It didn’t stick.) When I saw the plans at the library it became instantly clear that I had hit the purest form of gold – original, large format architectural blueprints, showing every detail.

Previously my best material to go off of was a handful of black and white images from the michiwawa.ca site. (A good collection of various period photos of the facilities at Wawa, but not very high resolution. And not every single angle is fully covered.)

The original architectural blueprint for Jamestown (Wawa) station survive in the collection of the Sault Ste. Marie Public Library Archives.

The plans show a two story building with an overall footprint of 78 by 25 feet, with a 28′ baggage/express wing on the west side and 35′ long second story for the station agent’s living space located above the main part of the station. The interesting part of the design is the cut corners on the public waiting room end of the building, making it not quite a simple rectangular building.

The lower story is brick, up to the lower overhanging eaves (not sure of the technical term for this type of decorative overhang), and wood-frame with asbestos shingles above the overhang and for the second story.

My HO scale front & back elevation drawings to lay things out to scale and plan the build before putting blade to plastic.

The first step in the project was of course to convert the images I took of the original plans into my own HO scale drawings in order to lay out the overall dimensions and locations of doors, windows, etc. on paper before I start cutting plastic and wasting material. I spent some time working on figuring out the drawings from the various images of the original plans this fall, until I had HO scale elevation drawings of all four sides and a top-down drawing of the roof/building footprint. With the scale drawings in hand, I could begin to transfer the measurements to plastic and start cutting out walls.

Front and rear walls with window and door openings rough cut out and ready for cleanup.

All of the wall pieces were cut from .040″ plain styrene sheet, with door and window openings carefully measured, cut out and filed clean.

Detail of wall cap over passenger waiting room wing.

Above we see a detail of the treatment of the top of the walls. The architectural plans show the upper walls to be constructed of 2×6 framing. The very top of the wall is capped with a standard 2×6 header and then an overhanging 2×8 header above that, capped with copper flashing.

To represent this, and also to set up for the next step in constructing the recessed roof, I installed 2×10 strip around the inside of the tops of the walls, to bring the thickness of the top of the wall to near 6 scale inches and provide a proper depth to install the plastic sheet for the roof substrate. (More to come on roofing in a future post…)

Then the top of the wall was capped all around with a scale 2×8 strip to create the slight overhang at the top of the wall.

Basic form assembly complete, track side.

In the last two photos we see the basic assembly of the walls and roofing base completed, forming the basic structure.

There’s still a long ways to go on completing and detailing this structure, but with the walls and basic roof substrate assembled, it’s definitely starting to look like something!

Basic form assembly complete, street side.

So there it is so far. Stay tuned for more.

Note: if you use facebook, there are some additional images from this build in an album on the facebook page I have there tied to this site. You can find some additional project photos and other bonus materials shared there in addition to the regular blog post links.

Excel Car Cards and Waybills

Here I will discuss how I created my own car cards and waybills using Microsoft Excel’s spreadsheet software.

Note: this will not be intended to be a detailed tutorial on Excel, or the specific features I’m using; I will show enough to convey how I’m using the feature(s), but for additional details I will refer you to Excel’s documentation or other help sites. It should also be possible to achieve these results using similar tools in other spreadsheet software, but I leave that research to the reader as to how the tools in those softwares may differ from Excel.

Car Cards

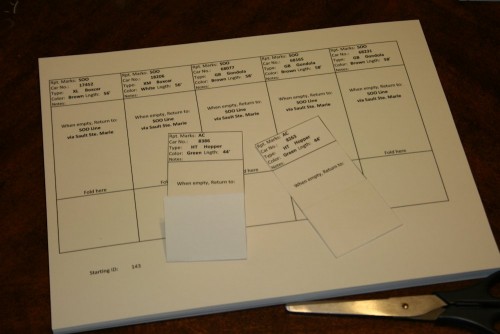
The specific design of the car cards and waybills is inspired by the ones we use at the club created and printed using the Ship-It model railroad software. They follow the same dimensions and general form factor, although I have tweaked the design a little to customize it for my own purposes (especially of the shipment waybill insert slips – see below).

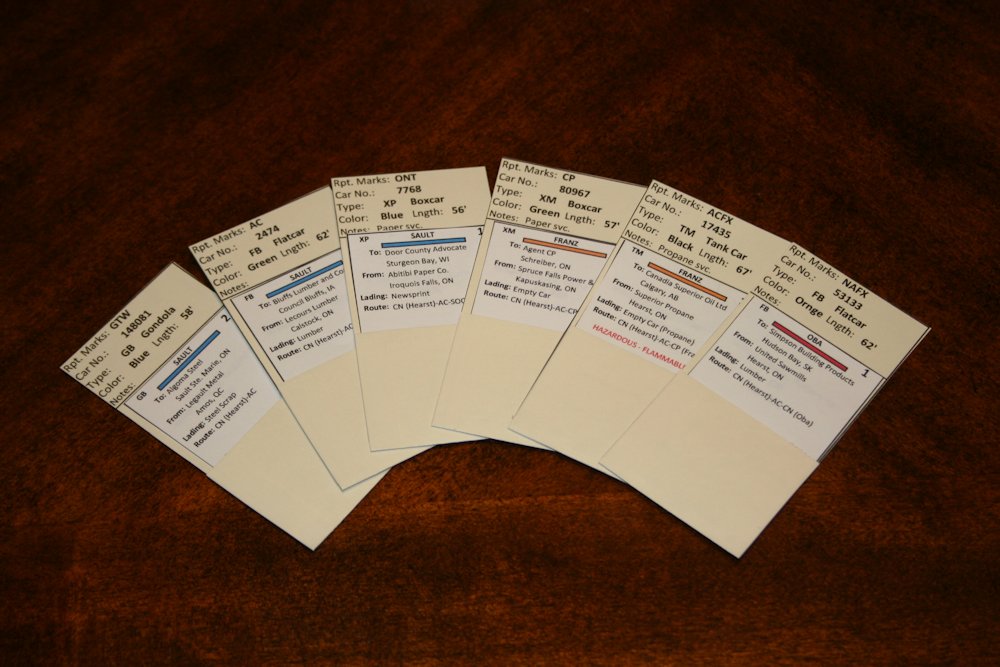
On the car card, the car information goes at the top, with the most important information (identifying reporting mark and number) in the central place of prominence. Other descriptive information such as type, colour and length are included below to assist in visually identifying the car. The Notes field may indicate other special features of the car, or usage restrictions (for example, “Paper service only” on boxcars meant for such).

The bottom of the card is designed to fold up and be taped to form a pocket into which the shipment/routing portion of the paper work (waybill) is inserted.

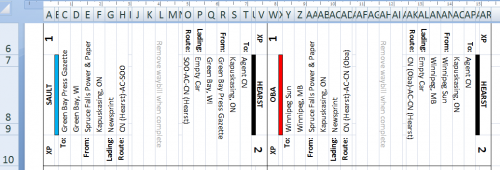
Below we see the Excel sheet I use for printing out my car cards. It took some tweaking to get the column sizes exactly correct, but otherwise looks pretty straightforward. However, under the hood all of the fields are defined with formulas that pull data from another sheet in the workbook. I didn’t want to copy and past page after page after page of hand-coded car cards (and especially the waybills with their vastly higher number of fields and flopped orientation) so I made one template page, and used Excel lookup functions to pull the data from another sheet, so the car data could be tracked and manipulated far easier in a standard grid format, and any arbitrary range selected for actual printing. In this way, car cards for a large fleet of hundreds of cars can easily be created.

car car sheet

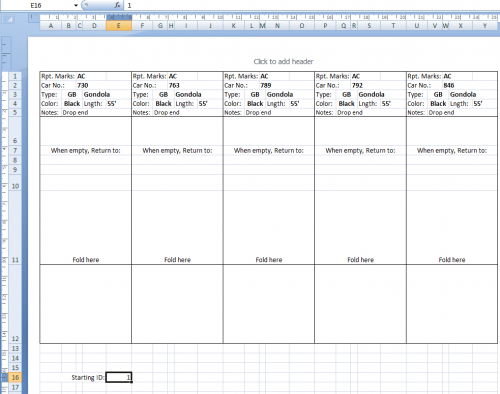
You’ll see in the first image above of the car card template sheet, a “Starting ID” cell below the cards (in cell E16, highlighted). I’m going to use the value in this cell to feed into the Excel lookup functions, which will extract data from the actual roster sheet, and populate it into the fields in the car card template for printing.

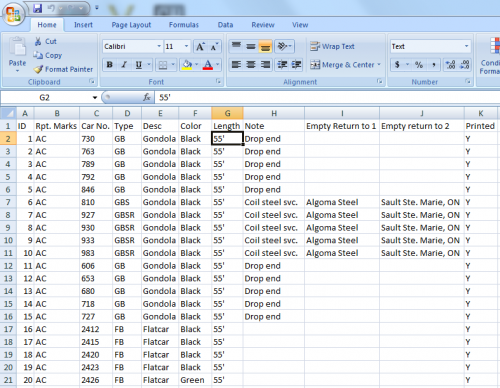
Below is the actual roster information, contained in another sheet within the same workbook. Way easier to read and keep track of, and much more additional notes and information can be added in further columns to the right; our lookup only needs to deal with the first ten columns. Note in particular the first column with the heading “ID”. This is the value we’re going to lookup, and then populate the date from the other columns in the same row into the template sheet for printing.

car card data

Excel has several data lookup functions, and the one we want is the “VLOOKUP” function. The VLOOKUP function scans through a specified range of data, looking for a specific value in a particular column. Once that value is found in the search column, it can return a value from another column in that row. The VLOOKUP function in Excel looks like this:

=VLOOKUP( [value], 
          [source sheet name]![data columns], 
          [column # in data to pull result from], 
          [allow approximate matches])

In my case above, we’re pulling the lookup value (the car ID) out of cell E16, so the reference to that cell is the value. (For the subsequent car cards, we want to pull the next several cars in the data sheet, so the lookup value will be the value of (E16)+1, (E16)+2, etc., so if the starting ID is 1, car cards 1 through 5 will be printed.)

The name of my second sheet with the car data is “Data”, and the data is in columns A through K in that sheet. (The VLOOKUP function will scan the first column trying to find the lookup value.)

The last argument should be set to FALSE as we only want an exact match.

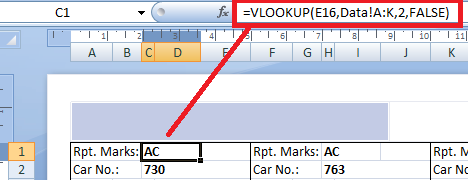
Put that all together, and the lookup for the reporting mark field on the first car card looks like this:

lookup function

One thing to know about the VLOOKUP function in excel, is that if the returned cell in the data sheet is blank, the VLOOKUP function will display that as a 0 in the display cell. For some fields here, like the Notes and Empty return information, I definitely want the cell to be blank if there’s no data, not rendered as zeroes. To protect that, any cell that’s using a VLOOKUP that you want to allow to be blank will need to be wrapped with an Excel IF function, which looks like this:

=IF ([condition], [value if true], [value if false])

In this case, my condition will be if the value from the lookup function is blank (“”), make the cell blank, otherwise insert the returned value. If I do this for the example cell in the image above, it would end up looking like this:

=IF (VLOOKUP(E16,Data!A:K,2,FALSE)="", "", VLOOKUP(E16,Data!A:K,2,FALSE))

… which actually looks far more complicated than it is, since the whole lookup function is pasted in there twice.

IMG_5039

Waybills

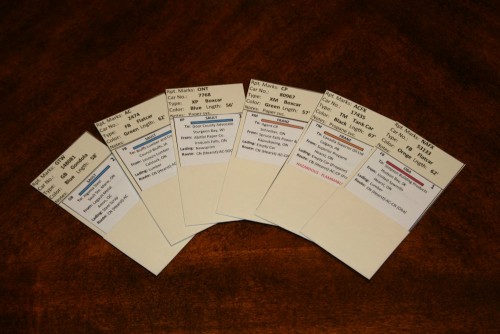
I also used these tools to create my own custom waybill template. This was a lot more work than the car cards simply owing to the sheer number of fields involved in each waybill compared to the car card, and managing to fit 10 of them per sheet as opposed to 5 per sheet for the car cards. However, it was largely a matter of just taking the time and effort to copy and adjust the lookup functions much as above. While there are quite a number more fields to deal with, and more waybills fit onto a page than the car cards, the general method is exactly the same. Just time consuming to do that many fields. But once it’s done, you have a dynamic template that can easily and quickly create and print out hundreds of different waybills.

waybill template

My waybills are “two-cycle” with each one printed on one side of the paper and having two separate moves (generally an empty move and a loaded move), one of which is visible at a time and rotated (between sessions) in the car card pocket to display the second move when the first move is completed. This required printing the second move upside-down to the first – although Excel doesn’t allow you to set the text orientation in a cell to “upside down”. It does however let you do “up” and “down”, so I just designed the waybills sideways with each half oriented a different way, as seen in the image above.

Two-sided four-cycle waybills can also be created, just more of the same effort to set up the additional fields on the second page, and a bit of playing with the page margins and column positions to find the proper alignment so that when the second page is printed on the reverse of the first, the waybill edges line up properly for cutting them out. I only needed two-cycle bills, so I did not bother with this effort.

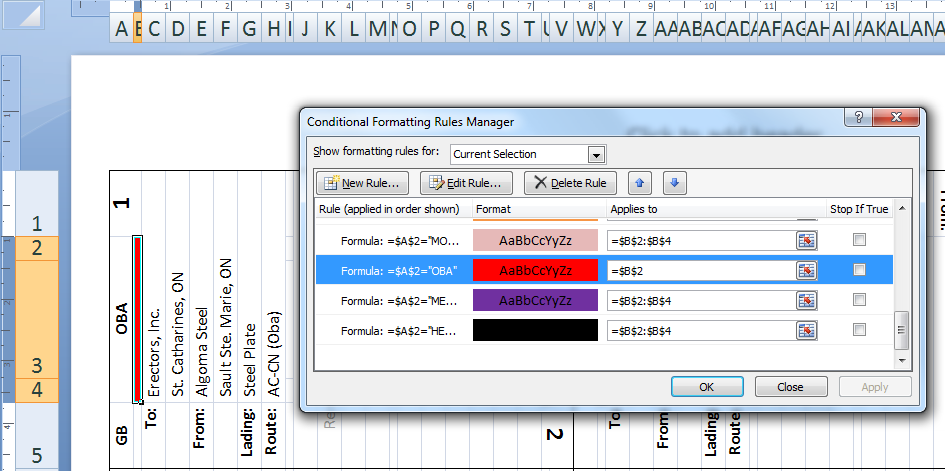
You’ll see that my waybill template includes a block code for switching/routing at the very top, as generally this is the most important information required when switching or handling cars – “Where does this go?” and using a routing or block code at the top of the waybill makes it easier to identify the car’s immediate destination. This is reinforced with a colour-coded bar below the block code which matches the block. (I plan on making a chart of the blocks and a system map readily available to operators in the model railroad’s timetable document.)

To make the colour coded bar, I created a series of Conditional Formatting rules to apply a fill colour to this cell based on the text value in the block code cell above/beside it.

Once the waybill template is completed, it’s a matter of playing around in the data grid to create the various shipment information, and then printing them out in the template by adjusting the starting ID/group to fill in the data and print the results. Cut out with scissors, insert into the appropriate car cards, and voilà:

IMG_5042

Files

A few people asked if I would share the actual Excel files. Here they are.

Notes: The car cards file is useable as-is by anyone. I cleared out my own roster information so the entire world doesn’t know my inventory, just leaving the first few cars behind to illustrate how the data works. For the waybills file, I actually uploaded my file as-is, including all my data. Consider it a gift to other ACR modelers, and shows how the data works. Note that if you’re adapting the file to your own railway and want to include the colour coded bars that match to the destination block codes, you’ll have to go in and edit all the conditional formatting rules for your own station/block names. Note that this workbook also contains the customer order sheet described in my previous post.

If clicking on the link doesn’t open the file properly, right click and choose “Save As…” from the menu that comes up. (Mac users with a one-button mouse, I believe you hold the “Command” key and click for this menu.)

Update: see also followup post where I add company logos to the cards.

Simulating Customer Demand on a Model Railroad

In this post, I’d like to discuss one method to really improve on the car card and waybill operating system for simulating freight traffic and moving cars around a model railroad. This post won’t discuss the particulars of how the system works as a whole, just a way to enhance it by controlling or introducing variability into how many new cars are brought into the layout, and which customers will get switched.

Someone recently asked a similar question on a Canadian Railway Modelers facebook group of “how to determine which industries on a switching layout get cars in a session”, so I thought I’d take the opportunity to expand on my version. A few different ideas that people have used, of which this is only one, were given in response to the facebook question such as rolling a die for each industry, drawing random playing cards, etc. The spreadsheet system does have an advantage of being easily scaleable to a larger layout as well as a smaller one, but it’s certainly not the only approach.

The system described here was initially developed by my friends at the Waterloo Region Model Railway Club to generate traffic on our large club layout. I’ve copied it to play with generating traffic for my own layout (which doesn’t exist yet, but I can plan and experiment with traffic for the future) and also tweaked a few minor aspects of the system to customize it for myself.

Use With CC&WB and Other Systems

My club and I have used this in conjuction with a car card & waybill system to select number of fresh waybills to assign, but really the spreadsheet just generates a number of cars and you can use this with any sort of system from CC&WB, to tab-on-car, to manually written switch lists, or almost any other form of non-computerized car forwarding system. The spreadsheet just takes the every day decision making out of how many waybills/tab markers/cars to select for a customer after the initial up-front setup of the sheet. And if you find things aren’t quite balanced you can always play with tweaking the numbers in the spreadsheet.

If you’re using with with car cards and waybills (CC&WB) note that one major thing that is assumed by this system is that you are constantly removing and replacing waybills in the car cards and one waybill/car card combination is NOT permanently associated with each other. I’ve seen a number of modelers and even software programs (like Ship-It!, which our club used to actually create and print our car cards/waybills, but required some serious work-arounds of the system in some places including separate databases for the car cards and waybills due to the 1:1 permanent waybill to car card assignment issue…) using systems that permanently assign a specific four-cycle waybill to a specific car. This I think also leads to one of the more common complaints of the CC&WB method being “too rigid” with the same car always travelling the same pattern. Which is only an issue if you have a rigid mindset of never changing the waybill assigned to the car. Or your cars are so unique

Also, since we’re varying the number of new waybills assigned to empty cars in staging (or interchange tracks, or yard storage), this method will end up requiring breaking down and re-making inbound trains in a “fiddle” staging yard (or else assigning generic “through” waybills to remaining unused cars that are left over in the trains in staging, if you don’t want to physically change around any cars in staging).

If you aren’t already familiar with the “car card and waybill” system, I could do a separate primer later, but there’s plenty of information out there if you search the phrase “model railroad car card and waybill”. The short version is that it was designed by a model railroad back in the 1970s to simulate the important details from a real shipping waybill, but making all the paperwork reusable by separating the car and shipment information into two pieces of paper that combine together, usually by inserting the “waybill” (shipment details) into a pouch built in to the car card.

How it Works

The basic method is to generate car orders between a given minimum and maximum number of cars on a percentage frequency, or odds of occurring. (i.e. “30% of the time”, “50% of the time”, “100% of the time”…) By using a spreadsheet with a random number generator, it’s simple to generate varying orders for a number of different customers or car types. By varying the minimum/maximum and frequency values, it’s possible to have different orders range from completely constant (i.e. min/max the same at 100% frequency) to completely variable, with each order having a different statistical odds of occurring or range of amounts of cars to order.

I also figured out a way to tweak the spreadsheet to allow some orders to be generated on specific days of the week (e.g. Mondays, Wednesdays, etc.) which can be helpful if you have certain trains that every other session, or to reduce traffic for a “Weekend” session with less trains if you have fewer operators available. I’ll discuss this tweak at the end.

Setting up the Order “Pools”

Since the point is to control customer demand, you’ll generally want to have an order line for each significant customer/car type. However pools can also be somewhat generic for through cars.

For example, on my future layout, I’ll have several different pulpwood orders for my major customers: Abitibi/St. Marys Paper (possibly split into separate orders for the spurs at Trembley, Limer, and Wyborn), Newaygo (possibly split into separate orders for Mosher and Trembley spurs), and Miscellaneous. For the Newaygo sawmill, in addition to the inbound logs, I’d also have an order for lumber flatcars, and one for woodchip gondolas. A few other lumber flatcar orders would exist for other mills in Sault Ste. Marie and Hearst. I’ll also have some generic pools for CN overhead traffic between Oba and Hearst.

At the Waterloo Region club, which is a very large layout with a lot of traffic we actually developed a numeric classification/pool code system to replace the AAR car types on our car cards and waybills. We then organized and set up the customer order pools organized by these car types. This could be an entire discussion unto itself how we developed the specific details of this system, and while it’s probably sounding a lot more complicated right now than it actually is, and one doesn’t necessarily need to go this far, for now let’s just say that doing it this way for a large layout makes it much easier to organize the waybills and car cards by sorting on the classification/pool number and to generate realistic looking traffic by separating out different car types, configurations and assignments (for example assigned-service paper boxcars). Specific service assignments can also be indicated by a note on the car card like “Paper Service Only” but when re-waybilling over a hundred cars for a session, reducing the decision making by making the car types distinct is helpful. On a smaller layout, NOT reducing the decision making “could” be more fun by actually making you feel like you’re acting more like the local station agent in assigning cars for loading –

How to Setup the Spreadsheet in Excel

The original spreadsheet was created in MicroSoft Excel, and the formulas used here are specific to that program, although they may be similar if not the same in other spreadsheet software. Confirming that or figuring out the equivalent syntax or formula for different software is left to the reader.

Note however, that in laying out specific formulas, for simplicity of description I just referenced the columns (for example “= A + B”) while when actually entering the formulas you actually need to reference the specific cells (“= A2 + B2”). You can do this for the first column and then drag and fill down the sheet in Excel.

Basic Customer Demand based on a Percentage Frequency

The first four columns of the sheet are manually filled in and define the parameters of the order:

A – Description
B – Minimum cars to order
C – Maximum cars to order
D – Frequency% (0-100) – how often to fill this order

Then, we use a few columns to generate our random numbers and calculate the results:

E – Generate a random number between 0-100 to compare against the frequency column:
= RANDBETWEEN(0, 100)

F – Compare the generated result against the frequency. Output a 1 if less than or equal (so the order will happen), or 0 if over (it won’t happen today/this session):
= IF (E <= D, 1, 0)

G – Randomly generate the number of cars to pull within the minimum to maximum range specified. Note that we also multiply the result by the 1 or 0 in column F to make sure orders that have a frequency of less than 100%. This is the final number of cars to assign to this order for the session.
= RANDBETWEEN(B, C) * F

[Optional Advanced Feature] Generating Orders Based on a Specific Day of the Week (DOW)

The original spreadsheet we used at the Waterloo club was exactly as above, using a simple percentage frequency to control whether an order is filled or not. (Setting a minimum value of 0 cars to order will also reduce how many times a car shows up, but the statistical probability is a bit harder to calculate if the frequency is also less than 100.) Most of you will probably stop at this point, but this was an interesting proof of concept so I’ll go ahead and discuss it (though it gets a bit more technical).

In some cases, you might have a railway that runs certain trains on alternating days, or a reduced schedule on weekends (which could be helpful to be able to run a “weekend” schedule for a session if you know you’re going to have a smaller operating crew, or a fuller session with extra traffic if you have an extended session with extra crews. Using a couple of additional slightly more advanced Excel formulas and features I was able to be able to also be able to specify Days of Week for each customer pool to be ordered. (I specifically set it up for Day of Week, but you can use the same technique for “Full”, “Normal” and “Reduced” sessions.)

Note – this will get a little bit more technical to evaluate the day of week.

In this version, the first six columns (A-F) are the same, but the final result will be calculated a little differently, so delete column G for now.

We’ll also need a few extra columns to represent the days of the week, so we’ll use up the next seven columns* (G through M) to represent the days Monday-Sunday. Put a “1” in the column for each day the shipment *should* occur. Leave blank for the days to be skipped.

*Stylistically, I actually put my DOW columns all the way to the right hand side of my own spreadsheet to make it more readable when using and editing the sheet, but we’re mainly talking concept here so I’m just going to keep everything in the order I discuss them right now. Just make sure if you put things in a different order to reference the column that contains the right data. Another suggestion to make the sheet better to look at is to change the text colour on the calculated comparison columns to white or light grey so those numbers aren’t visible if you print out the sheet. As mentioned before, you can also adapt this concept to make different orders for high/normal/low traffic sessions, using three columns here instead of seven. Adjust other column references accordingly.

Column “N” then evaluates against the selected Day of Week. This is where things get interesting. First of all, I stuck a cell at the very top of the spreadsheet where I can indicate the Day of Week for the session I’m generating orders for (1 for Monday, through 7 for Sunday). In my case, that’s specifically in cell B1. Excel has an “offset” function which allows you to fill the value of one cell with the value of another cell in a different column in the same row. The function looks like this: OFFSET(reference, rows, columns) where the reference is a starting cell reference, and the number of rows and columns to shift over from that starting position.

In our case what we want is to use that function to check whether there is a 1 in the column for today’s DOW, by using the value from cell B1. So we want to shift over than many columns on the same row. But we also want to make sure that when we fill the cell formulas down to following rows, that the cell we’re referencing here doesn’t shift down a row with the other cell references. So we want to use an absolute cell reference to make sure that this never changes. Excel does this by putting a $ in front of the part of the reference we don’t want to change. So to make sure that the offset *always* references cell B1, the cell reference should look like $B$1 instead of B1.

In this case, to be absolutely clear, and to show the difference between the relative and absolute cell references, I’ll show the formula as if it were for row 3 of the sheet. The final result in cell N3 should look like this:
= OFFSET(F3, 0, $B$1)

Then finally in Column “O”, we again generate our random number within the min/max range and multiply it by both the frequency result and the DOW result:
= RANDBETWEEN(B, C) * F * N

There you have it! Now the spreadsheet will control the minimum and maximum number of cars, frequency (% odds of occuring) and also specific days of the week to order cars for a customer. And remember, if you simply want a particular customer to *always* get cars, just set the frequency to 100 and make sure there’s a 1 in all of the Day of Week columns. This order sheet is now completely as rigid or flexible as you could possibly desire, on a customer-by-customer basis.

Full spreadsheet column definitions (based on starting position in row 3):

Column Description Formula
A Name/Description
B Minimum
C Maximum
D Frequency (%)
E Frequency Random* =RANDBETWEEN(0, 100)
F Frequency Check* =IF (E3 <= D3, 1, 0)
G DOW Monday
H DOW Tuesday
I DOW Wednesday
J DOW Thursday
K DOW Friday
L DOW Saturday
M DOW Sunday
N DOW Check* =OFFSET(F3, 0, $B$1)
O Final order amount =RANDBETWEEN(B3, C3) * F3 * N3

* – Calculated column that can have its visibility reduced for readability when using.